 |
|
The Myers Report - September 29,1999 |
|||
|
A Channel Is A Channel Is A Channel, Not
|
|
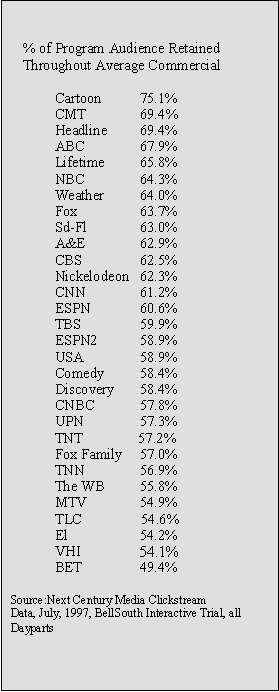
prudent to consider all available measures, so as to triangulate the problem from as many angles as possible. One of the measures is commercial audience retention: the percentage of the program audience that stays tuned through the average commercial on each network. This is of course a reflection of the degree to which each network’s audience tends to channel-switch. That in turn is a combination of two things: the types of people that generally view that network and the likelihood of the programs on that network to hold viewers back from switching away once they have switched in. The data in the accompanying table are some of the first of their kind to reach industry eyes. As digital set-tops and other forms of Interactive TV (ITV) roll out, we will be seeing more of such data since ITV in all its forms will make practical the collection of clickstream data for TV. Whereas Nielsen meters are accurate down to half minutes, clickstream data can be accurate down to milliseconds, and therefore are more useful for analyses of this type. |
|
We also observe that the music video channels tend to cluster at the low end of this spectrum. This is logical in that their programming can be enjoyed in small doses; one does not need to wait very long to see a plot resolve, for example. As mentioned, media planners ought to look at all measures, not just this one. For example, the high standing of Cartoon Network in this measure might well be offset by some other measure, such as attention or roomspeculation, while these retention data are empirical. The sample size of about 500 homes across a month is higher than the average Nielsen meter sample size in local markets and each network’s percentage is an average across at least 100 spot airing observations. The data show reasonable stability when broken out by top advertisers. For detailed data feel free to contact me via e-mail. Bill Harvey is chairman-CEO of Next Century Media and a regular columnist to The Myers Report. He can be reached via e-mail at info@nextcenturymedia. corn |